
September 13, 2026
Third-Party Risk Management for Canadian SMBsMaster third-party risk management for your Canadian SMB. Learn OSFI compliance, vendor monitoring frameworks, and how to secure your supply chain.
Read Full Post%20(1).webp)
Usman Malik
Chief Executive Officer
July 30, 2026

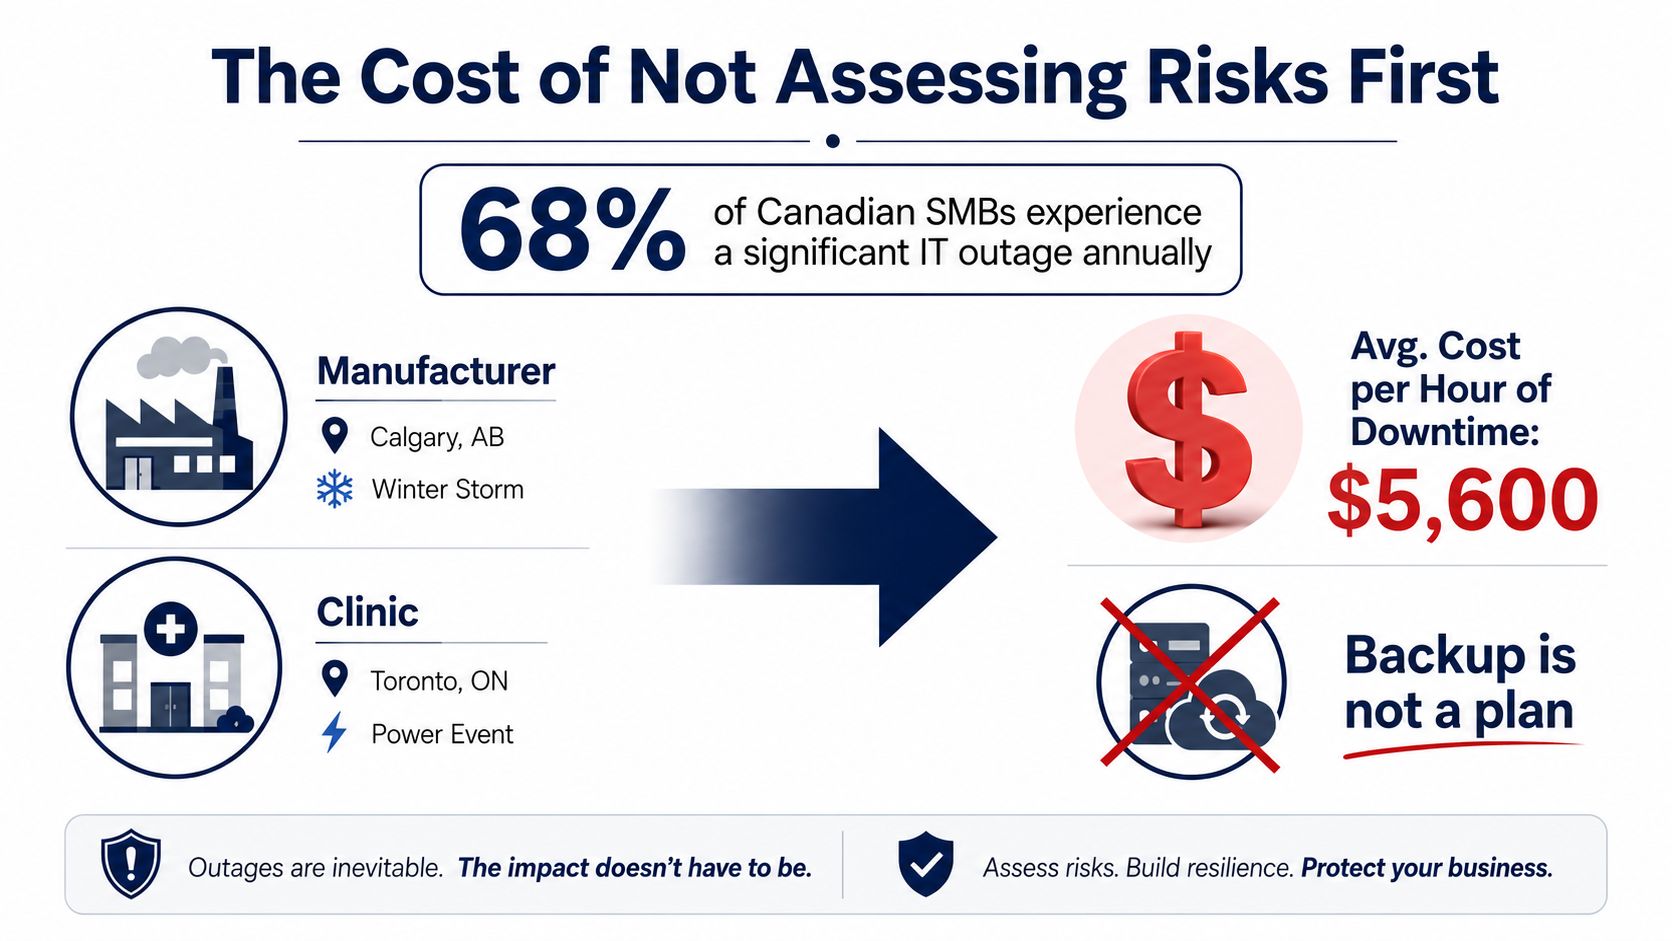
A lot of Canadian SMBs discover the gap the hard way. A clinic in Toronto gets through the morning, then a regional power event drops systems at lunch, or a Calgary manufacturer loses a winter shift because the recovery plan lives in a binder, not in a tested sequence. The cost is rarely just downtime, it's missed appointments, delayed production, stressed staff, and a leadership team asking why the backup stack didn't translate into recovery.
That's why disaster recovery plan risk assessment has to come first. It's the bridge between a business impact analysis and a recovery design that fits the business, because it forces you to rank threats by exposure instead of by instinct or whoever shouted loudest in the last meeting. AWS frames that kind of assessment around the probability and cost of each scenario, which is exactly the mindset that helps a Canadian clinic, law firm, or manufacturer decide whether to invest in redundant power, a backup site, or faster recovery objectives. CloudOrbis's continuity and recovery guidance fits that same practical lens.
For a useful starting point outside your own building, browse business recovery help and compare how your current plan stacks up against a real recovery workflow rather than a storage strategy.
A Toronto clinic can buy backup software and still be exposed if the power event that knocked it offline also took out internet failover, phones, and the front-desk workflow. The same pattern shows up in manufacturing, where a winter storm can stop a shift even though files are safe and backups ran overnight. The problem isn't always missing technology, it's buying the wrong controls before you've scored the risk.
A business impact analysis tells you what hurts if a system is down. A risk assessment tells you which threats are most likely to create that pain and what it costs to reduce them. AWS says to document the threat, risk, impact, and cost of disaster scenarios and recovery options, and that's the conversation executives understand when they're deciding between redundant power, offsite replication, or a secondary failover site. AWS's business continuity guidance makes that sequence explicit.
Practical rule: if you can't explain why a control exists in dollar terms, you probably haven't ranked the risk properly.
For Canadian SMBs, that matters because the hazard profile is regional, not generic. Wildfire, severe winter weather, flood, and power disruption show up again and again in emergency-management guidance, which means a plan that ignores location is already incomplete. A clinic in Edmonton, a law office in Oakville, and a plant near Calgary don't share the same outage pattern, even if they use the same cloud stack.
That's also why auditors and insurers take quantified assessments more seriously than broad claims about resilience. When the plan ties recovery priorities to exposure, not preference, it becomes easier to defend why one workload needs a faster recovery target than another. The rest of the article follows a four-stage workflow so the assessment produces something operational, not just a worksheet.
Start with the inventory, because you can't score what you haven't named. NEDCC's planning approach puts the risk assessment after the planning group is formed and asks for a working inventory of job titles, office equipment, applications, systems, servers, and software, plus the organisation's critical needs. That detail matters because recovery doesn't fail only at the server layer, it fails when the people and tools around the server can't function.
A good inventory should read like an operations map, not a hardware list. For each application, note who uses it, what it depends on, and what happens if it's unavailable. If reception can't access scheduling, billing can't post claims, or the plant floor can't print labels, those are real dependencies, even if the server itself is healthy.
For context on the asset side, CloudOrbis's IT asset management guidance aligns well with this kind of inventory discipline. The point is to capture the system, the users, and the process together, because that's what gives the risk register real weight.
Once the assets are mapped, pair them with hazards that can break recovery. In a Canadian setting, that means wildfire smoke, flooding, severe winter weather, power disruption, ransomware, accidental deletion, and key vendor outage. A common mistake is to stop at internal systems and miss telecom, cloud, supplier, and utility dependencies, even though those often become the first single point of failure.
A threat list gets useful when every item can be tied to a specific dependency, system, or role.
That's where a worksheet earns its keep. For each threat, ask what it would affect first, whether the impact is local or branch-wide, and whether a third-party service is part of the failure chain. If your remote users lose connectivity before your data centre fails, that's still a recovery risk, not a side issue.
For property and facilities teams, Axis Meter Solutions' guide for property managers is a good reminder that environmental issues can start small and still interrupt business operations. A leak sensor, a telecom dependency, or a utility feed may seem secondary until it becomes the reason the recovery timeline slips.
A workable disaster recovery plan risk assessment follows four stages in order, threat assessment, vulnerability assessment, impact assessment, and risk evaluation. That sequence keeps teams from stopping at “we identified some risks” and forces them to quantify exposure before choosing controls. The strongest plans treat vulnerability as more than a simple likelihood score, because the same threat can hurt two organisations very differently.
Threat assessment is the simple question of what can go wrong. Vulnerability assessment asks how exposed each asset is, and that should be scored using both magnitude, meaning the extent of operational disruption, and frequency, meaning how often the threat occurs in the region. Impact assessment translates the outage into business consequences, while risk evaluation ranks the result so leadership can decide what to fix first.
That's where region awareness matters. The same severe weather event can score differently in Oakville than in Edmonton, because the exposure profile, infrastructure mix, and operational dependencies aren't the same. A Canadian matrix should reflect the hazard profile of the province or metro area, not a generic threat catalogue pulled from a template.
For a practical comparison, how to check flood risk in Phoenix is a useful example of the discipline behind localised risk review, even though the geography differs. The method matters more than the city name, because the same idea applies when you're scoring flood exposure in Canadian municipalities.
| Score | Likelihood | Impact | Priority Band | Example Action |
|---|---|---|---|---|
| 0 to 2 | Low | Limited disruption | Monitor | Review at the next quarterly check |
| 3 to 5 | Moderate | Noticeable operational impact | Plan | Add control and assign an owner |
| 6 to 8 | High | Major business disruption | Act | Set a recovery target and test it |
| 9 to 10 | Very high | Severe business impact | Immediate | Reduce exposure and validate failover |
CloudOrbis's risk management framework guidance fits neatly with this kind of register, because the output is supposed to drive a decision, not sit in a folder.
Annualised risk is where the assessment stops being abstract. AWS gives a simple model, multiply annual likelihood by potential consequence cost, and you get a dollar figure that can be compared across threats. In AWS's example, weather events at 10% per year with $100,000 in consequences produce a $10,000 annualised risk, while power outages at 5% per year with $150,000 in consequences produce $7,500, for a combined $17,500. AWS's disaster recovery whitepaper uses that exact logic.
For a Canadian SMB, the benefit is blunt and useful. If one risk justifies redundant power and another justifies a faster recovery objective, the dollar exposure gives you a way to defend the spend without leaning on technical preference. It also helps with trade-offs, because not every threat deserves the same level of mitigation.
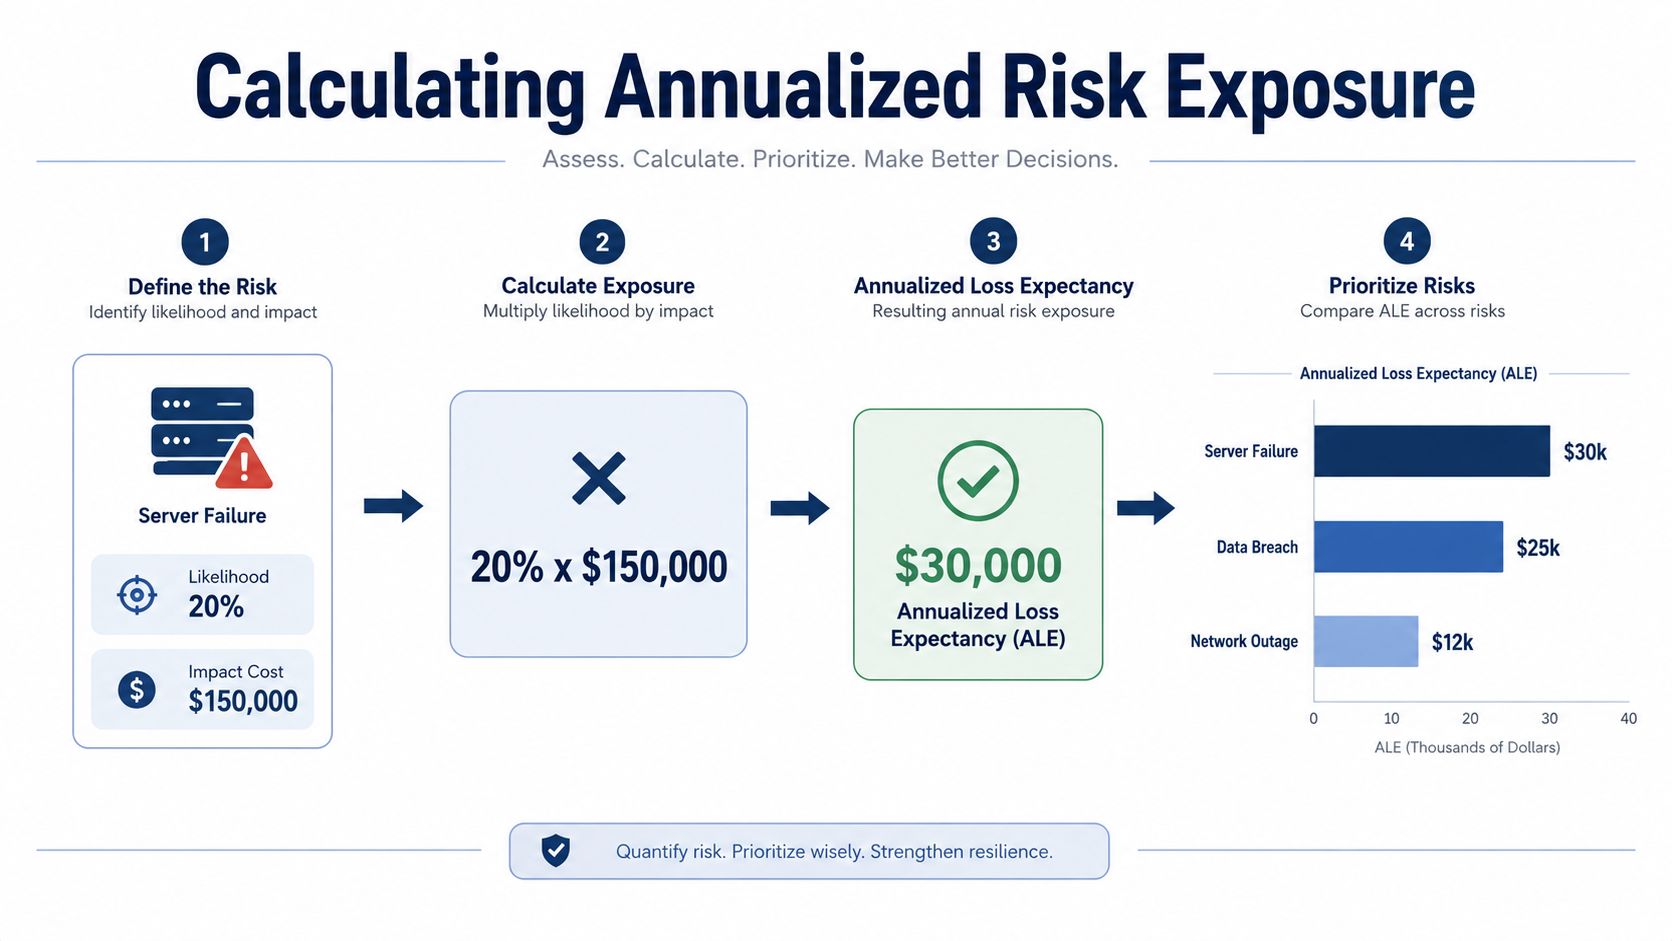
The next move is to sort the register by exposure and pick the top three to five items that drive the plan. Cisco's disaster recovery guidance describes scoring risks on a 0 to 10 likelihood scale and sorting them by business priority, while UNDP's methodology adds exposure and loss analysis before choosing risk reduction options. Cisco's disaster recovery planning guidance supports that ranked approach.
Don't write controls for every possible risk. Write them for the risks that can actually change your continuity posture.
That's the difference between a recovery plan and a wish list. If you try to treat every scenario with equal urgency, the plan gets heavy, expensive, and hard to test. If you focus on the highest annualised exposure first, you get a document the operations team can execute.
CloudOrbis's vulnerability management guidance is relevant here because the same prioritisation logic belongs in security and recovery work. You're not trying to eliminate every threat, you're trying to reduce the ones that create the most expensive interruption.
Once the top risks are ranked, the recovery design starts to make sense. A power disruption might call for redundant power and a documented failover runbook, while ransomware might point to immutable offsite backups and a restoration sequence that isolates affected systems before reintroducing them. The control only matters if it supports the business target, so each risk should be paired with a defined RTO and RPO.
AWS's business continuity framing is helpful because it says the plan should document the threat, risk, impact, and cost of each scenario and recovery option. That keeps the discussion grounded in operational reality instead of vague resilience language. The result should be a control matrix with an owner, a target recovery window, and a clear recovery point target.
Single points of failure often sit outside the server room. Telecom, cloud platforms, suppliers, and utilities can all break recovery first, which is why the assessment has to rank those dependencies alongside internal systems. If your payroll or patient workflow depends on a vendor portal, that dependency belongs in the same register as the application itself.
For practical recovery planning, CloudOrbis's recovery time objective guidance helps translate impact into a realistic restore window. A workload that can tolerate a longer outage does not need the same design as one that stops revenue, patient flow, or production the moment it goes dark.
Useful distinction: a backup is evidence that data exists. A recovery plan is proof that the business can get that data back under time pressure.
That's why the control list should include partial restores, full failover steps, and failback steps. Partial restore proves the backup is usable, full failover proves the alternate environment works, and failback proves you can return to normal without creating a second outage. If those three actions haven't been tested, the plan isn't proven, no matter how polished it looks on paper.
Most SMBs collapse testing into one event, then call it validation. That doesn't hold up under pressure, because a sample file restore, a full environment failover, and a failback are different exercises with different failure modes. Industry guidance on disaster recovery testing treats those as separate steps for a reason, and that separation matters when you're trying to prove the plan works. Druva's disaster recovery testing guidance is clear on the difference.
The cadence also has to be realistic. A 2026 review says 40% of organisations test DR plans less than once a year, which is a problem for anyone who needs audit evidence or customer assurance. The same source says 85% of companies that fail a DR audit face regulatory fines, so testing can't be treated as a nice-to-have in regulated environments. WorldMetrics's disaster recovery statistics review gives those figures.
A practical schedule for tier-one systems is quarterly tabletop walkthroughs, a biannual partial restore, and an annual full failover. That gives you regular proof without turning every month into a recovery drill. Tier-three systems can be tested less aggressively, but they still need some kind of documented validation.
| Test type | Purpose | When to run it | What to capture |
|---|---|---|---|
| Partial technical restore | Validate sample files and databases | Quarterly or biannual | Restore time, errors, owner follow-up |
| Full failover test | Stand up the alternate environment end to end | Annual for critical systems | Service confirmation, dependency issues |
| Failback test | Return to primary cleanly | After major changes or annual cycle | Data sync, rollback issues, sign-off |
Regulated Canadian healthcare, finance, and legal teams need this evidence because the audit trail matters as much as the event itself. The plan should show what was tested, who observed it, what failed, and what changed afterwards. A test without documented lessons learned doesn't improve the next run.
Practical rule: if the test doesn't feed the risk register, it was just a rehearsal.
A good recovery plan gets weaker when nobody owns the updates. The simplest governance rhythm is a quarterly risk-register review, a post-incident reassessment within 30 days, and an annual full plan refresh aligned with the business impact analysis. That cadence keeps the document tied to actual operations instead of last year's assumptions.
Ownership should sit with one accountable person, often a vCIO or operations lead, so changes don't drift between IT, operations, and leadership. The review should also check whether vendors, telecom paths, or cloud dependencies have changed, because those external links are often where recovery assumptions age first. A managed services partner can help keep the cycle moving, and CloudOrbis Inc. is one option for organisations that want managed IT, cybersecurity, backup, and disaster recovery oversight handled as one operating process.
The equity angle matters too. Recent peer-reviewed research found that contemporary disaster risk models still don't adequately account for how hazards affect marginalised groups differently, which means an asset-only view can miss who loses access during an outage. In Canadian environments, that can affect remote staff, branch users, clinic patients, and client-facing teams who depend on more than the RTO/RPO table. Nature Communications's research on disaster risk models makes that gap hard to ignore.
By the time the cycle is in place, the organisation should have a working set of artefacts, asset inventory, scored risk register, control matrix, RTO/RPO table, test schedule, and governance cadence. That's the minimum structure that keeps the plan live.
If you want a disaster recovery plan risk assessment that's built for Canadian operations, CloudOrbis Inc. can help you turn the register, controls, and testing schedule into a plan your team can run. Visit CloudOrbis Inc. to discuss managed IT, cybersecurity, backup, and disaster recovery support that fits the way your business works.
September 13, 2026
Third-Party Risk Management for Canadian SMBsMaster third-party risk management for your Canadian SMB. Learn OSFI compliance, vendor monitoring frameworks, and how to secure your supply chain.
Read Full Post
September 12, 2026
Managed Services Cost: A Practical Guide for Canadian SMBsUnderstand managed services cost for Canadian SMBs. Learn pricing models, industry factors, ROI, and how to choose the right provider for your business.
Read Full Post
September 11, 2026
Managed EDR Services: A Practical Guide for Canadian SMBsLearn how managed EDR services detect, contain, and respond to threats around the clock. A practical guide for Canadian SMBs evaluating providers, pricing
Read Full Post
